




An account-wide email delivery rate can look healthy while one brand struggles to reach its audience. That happens because the rate counts messages accepted by receiving servers, not messages placed in inboxes.
For publishers, agencies, and software teams sending across several identities, a single average can hide differences between brands and mailbox providers. Treat server acceptance and inbox placement as separate measures, then examine performance by identity and provider.
How Do You Calculate Email Delivery Rate?
Calculate email delivery rate by dividing accepted messages by messages sent, then multiplying by 100. Count messages, not connection attempts, and use the same reporting window for both totals.
A server can temporarily refuse a message before accepting a retry. Counting every attempt as a separate message would inflate the denominator and make the result misleading.
Calculate acceptance after retries resolve
Consider a hypothetical campaign with 10,000 messages sent and 9,650 accepted. The calculation is 9,650 ÷ 10,000 × 100, giving a 96.5% delivery rate. The remaining 350 messages were rejected or bounced.
A hard bounce is a permanent failure, such as a nonexistent address. A soft bounce is a temporary failure, such as a full mailbox. Neither counts as accepted while the failure remains unresolved, but a temporarily deferred message can later succeed.
The distinction matters when calculating email bounce rate. A campaign measured while retries remain pending won't necessarily have the same result after its sending window closes.
Keep these 6 numbers together
Email delivery metrics, what they count and how to calculate them
| Metric | What it counts | Formula |
|---|---|---|
| Delivery rate | Messages a receiving mail server accepted | Accepted divided by sent, times 100 |
| Bounce rate | Messages rejected, hard or soft | Bounced divided by sent, times 100 |
| Inbox placement rate | Messages observed in the intended inbox through seed tests or placement reporting | Inbox placements divided by tested messages, times 100 |
| Spam placement rate | Accepted messages filtered into spam | Spam placements divided by sent, times 100 |
| Missing rate | Messages blocked or deferred, reaching neither inbox nor spam | Missing divided by sent, times 100 |
| Complaint rate | Recipients who marked the message as spam | Complaints divided by delivered, times 100 |
These are operational formulas, not interchangeable provider definitions. Placement tests use their tested sample, while mailbox providers can use different eligible populations when calculating complaints.
For the same complaint count, a smaller delivered denominator produces a higher complaint rate. Poor engagement doesn't change the arithmetic, but recipient dissatisfaction can increase the numerator.
Calculate these metrics for the largest recent send, preserving each denominator, before applying the identity-level tracking process below.
Why Doesn't a High Delivery Rate Mean Inbox Placement?
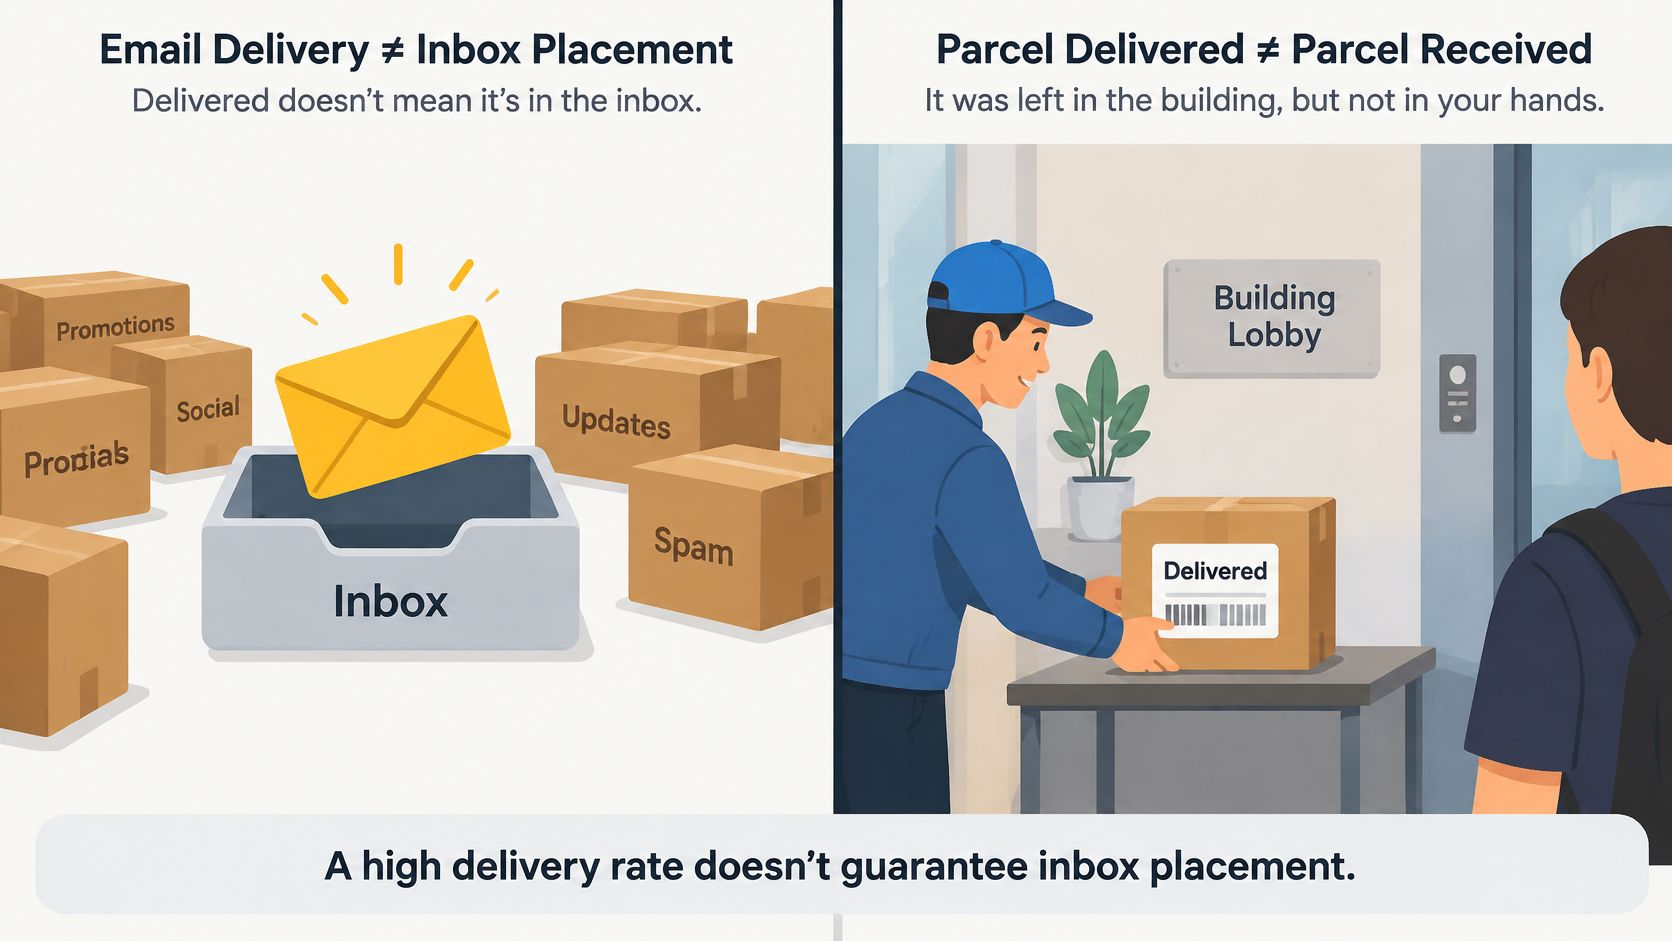
The mistaken belief is that a high delivery rate means the audience saw the message. A courier can leave a parcel in a building lobby without getting it to the intended desk. Server acceptance is the lobby, while inbox placement is the desk.
Inbox placement measures the share of messages that reaches the intended inbox rather than spam. In testing, the denominator is the tested message sample. It measures placement, not whether a recipient read the message.
The exact folder definition matters. A report that includes inbox tabs shouldn't be described as measuring only the primary tab. Reports need a consistent definition before their results can be compared.
Follow accepted mail to its destination
For example, suppose a hypothetical send contains 10,000 messages. A 98% delivery rate means 9,800 were accepted. If 15% of those accepted messages enter spam, 1,470 land there and 8,330 reach the inbox, assuming no other placement category.
That produces 83.3% inbox reach across the original send, despite apparently healthy acceptance. The delivery calculation hasn't failed. It answers a different question.
Validity's benchmark found that 83.5% reached inboxes among legitimate marketing emails globally in 2024, leaving approximately 1 in 6 outside the inbox. The same benchmark recorded 6.7% spam placement and 9.8% missing mail.
Separate spam from missing mail
Those categories call for different investigations. Spam placement means the provider accepted the message but filtered it away from the intended inbox. Missing mail means the benchmark observed it in neither inbox nor spam.
Deferred messages may succeed on retry or eventually bounce. Permanently rejected messages require action on the rejection reason rather than repeated identical attempts.
For retail teams connecting placement to campaign operations, Class A Media's email deliverability guidance for Shopify brands provides a business-specific companion to inbox deliverability reporting.
Report delivery and inbox placement together. For a recent send, separate spam from missing messages before deciding whether the problem concerns filtering or acceptance.
Which Mailbox Providers Have the Lowest Inbox Placement?
Microsoft has the lowest inbox placement among the mailbox providers in Pinpointe's comparison, followed by Apple. The useful lesson isn't a permanent provider ranking. It's that an overall result can conceal materially different outcomes across recipient domains.
Compare matching providers, not account averages
Pinpointe's average inbox placement by mailbox provider, 2025
| Mailbox provider | Average inbox placement | What the gap means |
|---|---|---|
| Gmail | 89.8% | Highest of these providers, but inbox placement still falls short of complete reach |
| Yahoo | 87.3% | Close to the all-provider average |
| Apple | 82.0% | About 5 percentage points below the average |
| Microsoft | 77.4% | Lowest of these providers, with the widest shortfall |
| All providers | 87.2% | An aggregate that conceals provider differences |
Sources: Pinpointe's 2025 inbox placement comparison.
These figures are reference points, not promises for an individual sending program. They also shouldn't be multiplied by accepted-message totals unless the benchmark and the sending report use the same denominator.
For a clearly hypothetical accepted-mail comparison, applying the table's Gmail percentage to 100,000 accepted messages would leave 10,200 outside the inbox. Applying its Microsoft percentage to the same accepted population would leave 22,600 outside it. That illustrates the size of a provider gap, not a forecast derived from the benchmark's methodology.
Check whether the audience mix changed
An aggregate can improve without any provider accepting or placing messages more successfully. Sending a larger share to a better-performing provider can raise the account average while another provider continues to deteriorate.
The reverse also holds. A falling aggregate doesn't automatically mean every sending identity has developed a reputation problem.
Compare each provider's placement result with its matching benchmark row, then inspect the same identity's trend over recent months. Investigate Gmail deliverability issues separately from an Outlook shortfall rather than applying the same remedy everywhere.
Pinpointe also cautions that privacy protections make opens less dependable as placement evidence. An open-rate change alone doesn't establish an inbox-placement change. Placement tests, provider signals and sending logs provide a more defensible starting point.
Start with the provider showing the largest unexplained deterioration against that identity's own baseline.
What Spam Complaint Rate Puts Delivery at Risk?
The complaint threshold depends on the mailbox provider, and Gmail distinguishes its operating target from its higher-risk boundary. Treating every published threshold as an acceptable routine result leaves too little room for deterioration.
Distinguish the target from the risk boundary
Google asks senders to keep user-reported spam below 0.1%. At 0.3% or higher, delivery risk increases and bulk senders can lose access to delivery mitigations, which are provider assistance for qualifying delivery problems.
Google states that eligibility returns only after the rate remains below that boundary for 7 consecutive days. Yahoo's guidance sets its bulk-sender spam-rate target below 0.3% and recommends monitoring through its Complaint Feedback Loop, which reports recipient spam complaints.
Complaint rate thresholds by mailbox provider
| Mailbox provider | Threshold | What crossing it means |
|---|---|---|
| Gmail | Below 0.1% is the target | At 0.3% or higher, delivery risk increases and bulk senders can lose delivery mitigations |
| Yahoo | Below 0.3% for bulk senders | The published bulk-sender ceiling requires complaint monitoring and corrective action |
Sources: Google sender guidelines and Yahoo sender guidance linked above.
A complaint tells the receiving provider that a recipient considers the message unwanted. Authentication doesn't override that feedback, which is why Gmail's bulk-sender guidelines address both identity verification and sending behavior.
Inspect the identity behind the average
Gmail's visible complaint metric isn't a complete placement report. Messages already filtered into spam don't necessarily generate the same user-reporting opportunity, so a low reported rate can't establish healthy reach.
In a hypothetical internal report using delivered messages as its denominator, a brand with 40,000 delivered messages and a 0.35% complaint rate generates 140 complaints. An account-wide average of 0.12% could conceal that brand's result.
Suppress reported complainers where identifiable feedback is available, honor one-click unsubscribe for marketing email and separate inactive recipients from routine campaigns. Check the highest-volume brand against the receiving provider's own metric first.
How Do You Track Delivery Rate by Brand and Provider?
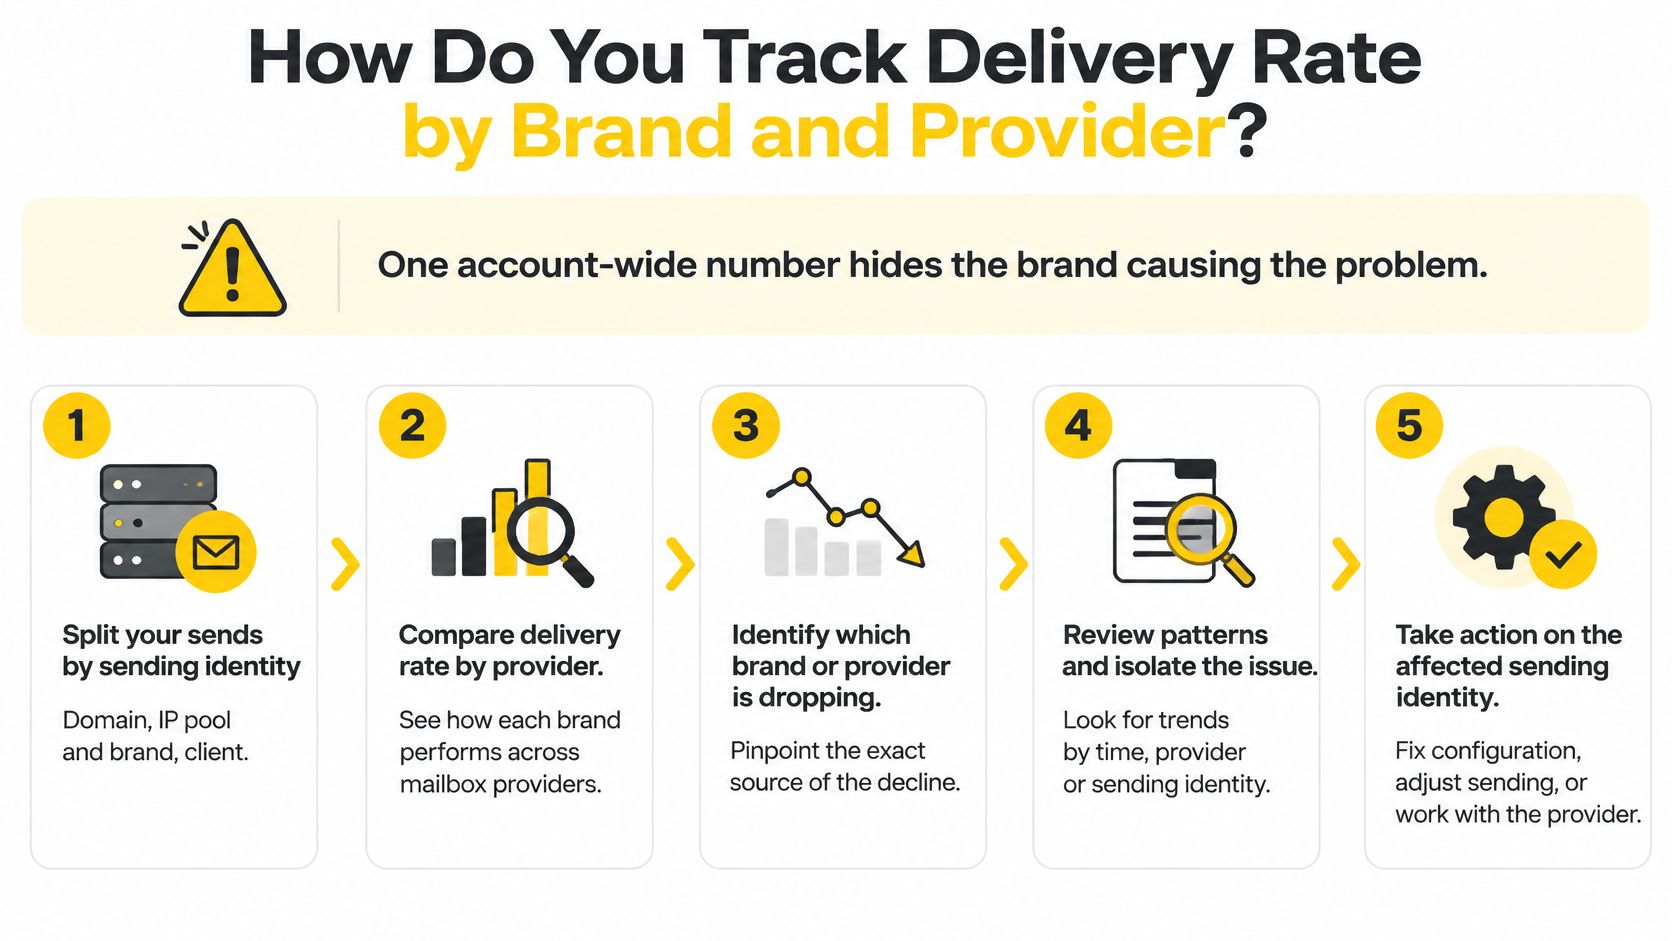
An account-wide number hides the sending identity responsible for a decline. Reporting needs to preserve the relationship between the brand, sending infrastructure and receiving mailbox provider.
The sending software records message events. The operating team assigns consistent identity labels, reconciles those events and adds placement evidence that acceptance logs can't supply.
1. Split sends by sending identity
Assign every message to its brand, client or publication, sending domain and IP pool. Without those labels, a decline can be detected but not reliably assigned to the team that can fix it.
2. Record accepted, bounced and deferred messages
Extract message-level events from sending logs and calculate acceptance using unique messages. Keep pending deferrals separate until retries resolve, so the report doesn't count a temporary refusal as a final failure.
3. Break each identity down by mailbox provider
Group recipient domains by the provider handling their mail. Compare acceptance, rejection reasons and deferred volume within each group rather than treating every recipient domain as equivalent.
4. Add independent placement evidence
Use seed tests, which send messages to controlled mailboxes and inspect where they land. Add provider dashboards for reputation and complaint context, but don't treat those dashboards as a complete census of inbox placement.
5. Attach provider-specific complaint reporting
Use available feedback loops and aggregate provider reports without assuming they expose identical information. Record the denominator and reporting period alongside each rate before comparing identities.
6. Record sending changes
Maintain a dated log of list imports, acquisition changes, authentication updates and warmup adjustments. When results change, those records identify what deserves investigation rather than leaving the team to reconstruct events.
Verify eligibility and authentication separately
Google defines bulk senders as organizations or domains sending approximately 5,000 or more messages to personal Gmail accounts within a 24-hour period. Its requirements include SPF and DKIM authentication, a DMARC policy that can begin at none, and an easy unsubscribe method.
SPF identifies authorized sending systems, DKIM adds a verifiable message signature, and DMARC checks alignment with the visible sender domain. These controls establish identity; they don't establish recipient demand.
A decline limited to a particular identity and provider points the investigation toward that combination's list, reputation, authentication or sending behavior. It doesn't prove that the entire program needs replacement.
Review the complete metric set monthly per identity, while monitoring complaint spikes and rejection changes during active sending.
Do Your Brands Need Separate Sending Setups?
A shared sending setup can hide which brand or provider is responsible when performance changes. Separate identities make it easier to isolate operational risk, especially for agencies managing white-label email marketing.
The deciding factor is whether each brand needs its own controls and reporting. SendX provides deliverability analytics that track delivery rates, bounces, spam complaints and inbox placement by mailbox provider, with benchmark comparisons. Sending records can also be reviewed by brand, provider and IP, including bounce reasons.
Give each identity its own controls
When one publication's results decline at a particular provider, separate domains, IPs, pools, warmup plans and throttles let the team investigate that identity without changing every title's sending schedule. Separation helps contain a shared-infrastructure problem; it does not remove the need to address the behavior behind it.
Warmup and throttling can be set per mailbox provider across 27 providers. That lets teams adjust sending conditions for the affected identity and provider rather than applying the same schedule across a whole portfolio.
Test a transition on one brand
A staged migration can reduce the risk of changing every identity at once. Senders can route one brand through SendX Infrastructure while keeping their current provider in place, then switch back if the results do not justify continuing. The decision rests on observed results for that brand, not assumptions about the entire portfolio.
Separate setups are most useful when they make the source of a problem easier to identify and give teams controls at the same level. They are not a reason to continue sending unwanted messages; each identity still needs responsible list and campaign practices.
Evaluate managed sending infrastructure for one brand.
FAQs
Does the CAN-SPAM Act apply to all email?
No. The FTC's guidance on the CAN-SPAM Act covers messages whose primary purpose is advertising or promoting a commercial product or service, including promotional email connected to commercial websites.
Covered marketing email needs accurate header and routing information, nondeceptive subject lines, advertisement identification where applicable, a valid physical postal address and a clear opt-out mechanism. The opt-out must remain available for at least 30 days after sending, and requests must be honored within 10 business days.
Legal compliance doesn't establish inbox eligibility. A message can meet those requirements and still generate recipient complaints or fail a mailbox provider's sending requirements.
Does Google Postmaster Tools show delivery rate at Microsoft?
No. Google Postmaster Tools reports on Gmail traffic, not Microsoft or Apple traffic. Its reputation and complaint information shouldn't be presented as evidence of acceptance or placement elsewhere.
For other mailbox providers, use sending logs for acceptance and bounce outcomes, controlled seed tests for placement, and the provider's own sender reporting where available. Those sources answer different questions and should retain their original labels.
Visit SendX to evaluate managed sending infrastructure that separates brands and reports delivery outcomes by mailbox provider and IP. Start with an identifiable placement or acceptance problem, then assess whether the reporting and controls make the next action clear.
